Probability & statistics
1.Distribution
A distribution is a set of all relative frequencies
for all possible events related to a random experiment.
We talk about probability distribution when the population of
a sample space  (or the random variable) is discrete; and
probability density in the case of contnuous variables.
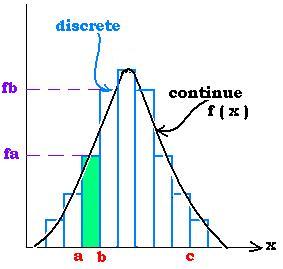
1.1. Discrete distribution
The probability to have an outcome a is fa ; the probability
to have an outcome b is fb. The probability to have
an outcome between a and b P(a < X < b) is:


P(a < X < b) = (b - a) x fa
That is the rectangle of area: (b-a) x fa

The mean value = Esperance = s = &sum,p(xi) xi
The variance = dispertion = var =  E(x2) - (E(x))2
1.2. Continue distribution (probability density)
The probability to have an outcome a is f(a); the probability
to have an outcome b is f(b). The probability to have
an outcome between a and b P(a < X < c) is :


P(a < X < c) = ∫ f(x) dx  [x: a → c]
That is all the area under the curve betwen a and c


Note that ∫ f(x) dx = 1 	[x: - ∞ → + ∞]

The mean value = Esperance = s = ∫ x f(x) dx
The variance = dispertion = var =  E(x2) - (E(x))2
2. The central limit theorem
The central limit theorem  says that the more the number
of the random variables is sum the more their distribution becomes
(converges to) normal (Gaussian distribution).
3. Some models of distribution
In the real world, each phenomena is associated to a model of distribution.
the most common models are:

1. The uniform or rectangular ristribution,
2. The triangular distribution
3. The negative exponential distribution,
4. Binomial distribution
5. Poisson distribution
6. Gaussian or normal distribution
|