Calculus III
Contents
3 Dimensional space
Partial derivatives
Multiple integrals
Vector Functions
Line integrals
Surface integrals
Vector operators
Applications
© The scientific sentence. 2010
|
|
Calculus III:
functions of more than one variable
Functions of two variables
Domains and graphs
1. Domain of functions
The domain of a function of more than one variable is
similar to that on variable.
For a single variable function, y = f(x), the domain is the set that contains
all the values of x that we could substitute in the function
and get back a real number. This domain is an interval (or intervals) of
values from the number line, or one dimensional space.
For a multiple variable function, y = f(x,y,..), the domain is the
set that contains all the values of x, y, ... that we could substitute
in the function and get back a real number.
For a two variable function, y = f(x,y), the domain is the
set that contains all the values of the couple (x,y) that we could substitute
in the function and get back a real number. This domain is a
two dimensional space .
2. Graphs of functions of two variables
The graphs of functions of two variables,
z = f(x,y) are surfaces in three dimensional space.
Example 1
The graph of the plane z = f(x,y) = - x - y + 1:
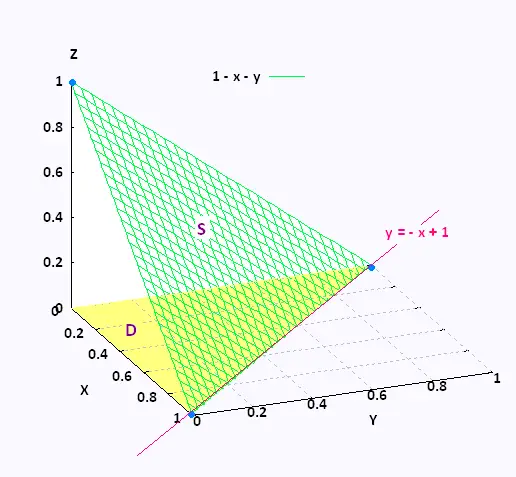
The surface is a triangle, partion of the plane x + y + z = 1, formed by the vertices (0,1,0), (1,0,0), and (0,0,1) that lies in the first octant.
Example 2
The graph of z = 8 - 2 x2 - 2 y2.
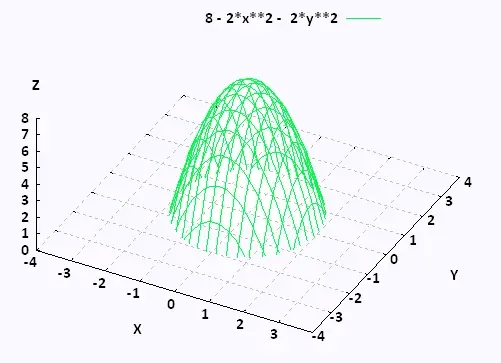
This is an elliptic parabaloid and is an example of a quadric surface.
3. Level curves of a surface
The level curves are called contour curves. The level curves of the function z = f(x,y) are the curves we get by setting z = k ,
k is a constant number. These curves are then two dimentional or plane. So
The equations of the level curves are z = f(x,y) = k.
Note that the equation f(x,y) = k can be written in the form f(x,y) - k = 0,
so the equation of the level curve becomes g(x,y,z) = 0.
Example 1
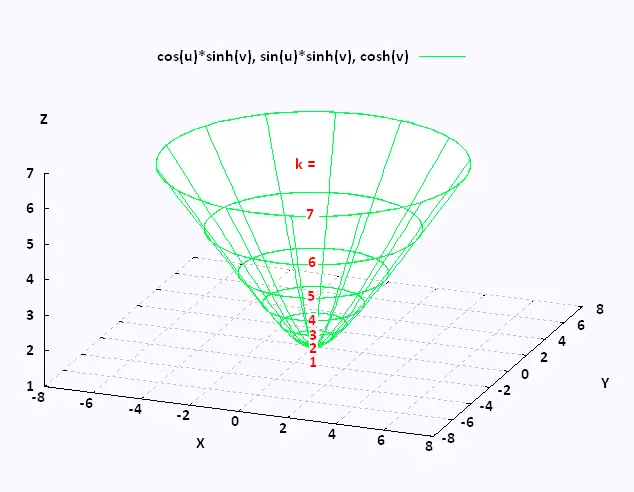
We want to identify some levels of the curves of z = f(x,y)
= √[x2 + y2] which is the upper half of a cone.
The level curves (or contour curves) for this surface are given by the equation
z = k , that is x2 + y2 = k 2 .
So, the level curves are circles of radius k centered at the origin.
Here seven level curves corresponding to k = 1, 2, 3, 4, 5, 6, and 7.
The contours represent the intersection of the surface that is given by
z = f(x,y) and the plane z = k.
The levels of z = f(x,y) are the levels of the function
f(x,y,z) = z - √[x2 + y2] = 0
4. Traces of surface
The contours is the intersection of the surface given by z = f(x,y) and the plane
z = k .
Traces of surfaces are curves that represent the intersection of the surface and the plane given by x = k or y = k .
Example
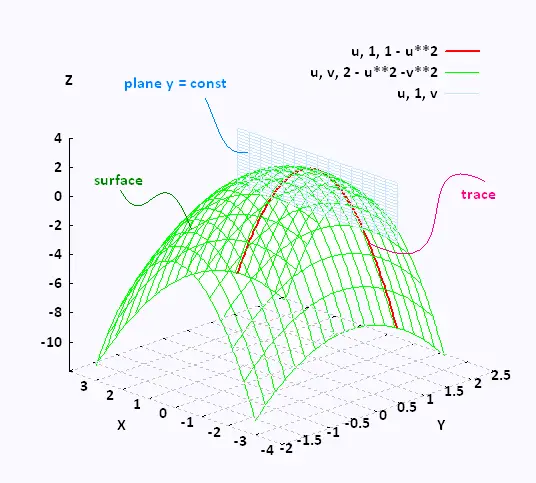
Here is an example that shows the trace of the surface
given by z = f(x,y) = 2 - x2 - y2 at
y = 2.
This trace is all the points in the intersection of
the surface and the plane y = 2.
|
|