Calculus III
Contents
3 Dimensional space
Partial derivatives
Multiple integrals
Vector Functions
Line integrals
Surface integrals
Vector operators
Applications
© The scientific sentence. 2010
|
|
Calculus III:
Graphs of 2D equations in 3D space
Graphing equations in 3D space
1. Graphs of a point in space
1.1. Graph of a point in 1D space
Let's take an example and consider the point x = 4.
What are the graphs of this point in  , ,
 , and , and  ? ?
In the space with one dimension,, we have a single coordinate system, that is the x-axis. Then the point x = 4 a is a point in a 1D coordinate system.
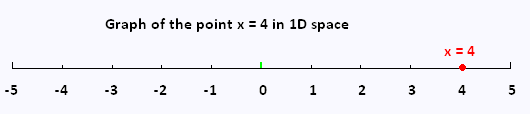
In 1D space, the graph of a point is a point.
1.2. Graph of a point in 2D space
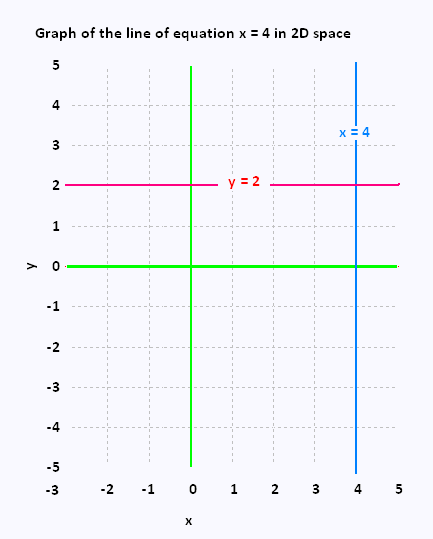
In R2 the equation x = 4 represents all the points of the coordinates (4,y), for any ordinate y.
This is a vertical line in a 2D coordinate system.
Also, the equation y = 2 represents all the points of the coordinates (x,2), for any abscissa x.
This is an horizontal line in a 2D coordinate system.
In 2D space, the graph of a point is a line.
1.3. Graph of a point in 3D space
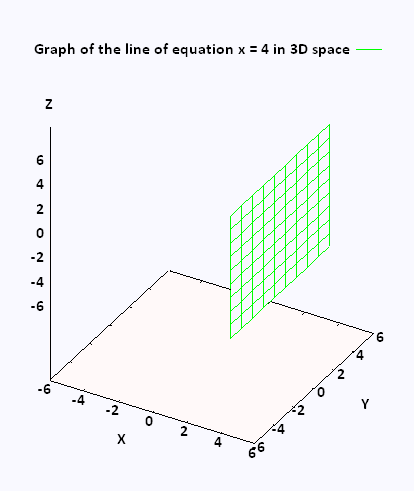
Now in R3, the equation x = 4 corresponds
to all the points that have the cordinates (4,y,z) ,
for any ordinate y, and for any applicate z.
This is the plane located at x = 4 and passes through the x-axis at x = 4.
This plane covers a whole plane parallel to the yz-plane.
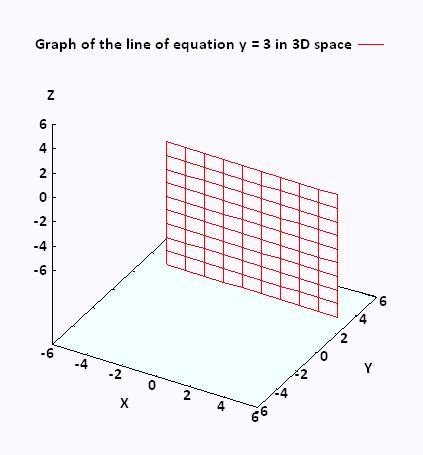
Similarly, the equation y = 2 corresponds
to all the points that have the cordinates (x,2,z) ,
for any abscissa x, and for any applicate z.
This is the plane located at y = 2 and passes through the y-axis at y = 2.
This plane covers a whole plane parallel to the xz-plane.
In 3D space, the graph of a point is a plane.
What are, in R3, the equations of the xy-plane, xz-plane,
and the yz-plane ?
Solution:
xy-plane: z = 0
xz-plane: y = 0
yz-plane: x = 0
2. Graphs of a line in space
2.1. Graph of a line in 2D space
 Let's take this example:
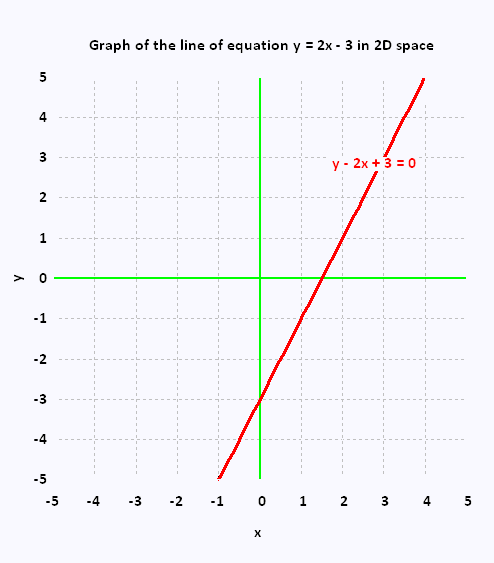
Line of equation
y = 2 x - 3 .
This equation has two variables x, and y. Therefore, the
corresponding space is the 2D space R2.
We already know that this form of equation
represents an an affine (or linear) function.
Plotting this function in 2D space gives a line
with a slope equal to 2 a y-intercept equal to - 3.
In 2D space, the graph of a line is a line.
2.2. Graph of a line in 3D space
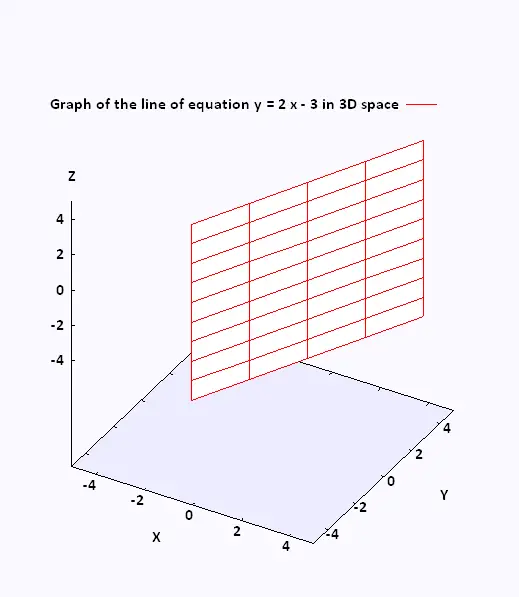
We consider the exemple of the line of equation
y = 2 x - 3.
In R3 space, the graph of this equation is not a line.
Since we do not have specified a value of z, this means
that z will take any value.
So, in R3, the graph of this affine function is then a
vertical plane that passes through the line given
by
y = 2 x - 3 in the xy-plane.
This vertical plane, parallel to the z-axis, intersects the
xy-plane with its 2D graph.
In 3D space, the graph of a line is a plane.
3. Graphs of a cercle in space
3.1. Graph of a cercle in 2D space
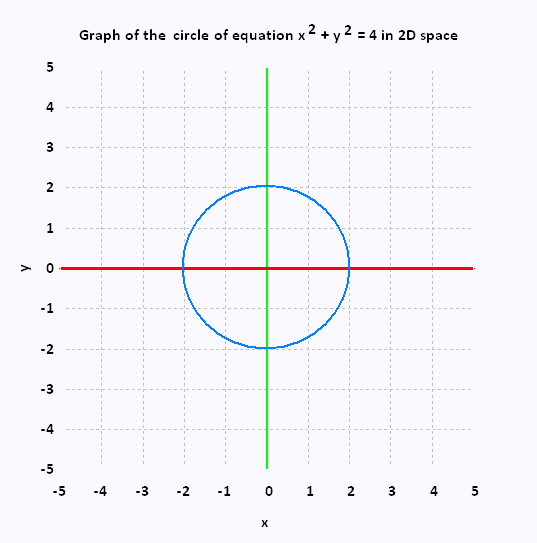
Let's consider a circle of equation
x2 + y2 = 4
As for a line, this equation contains two variables x, and y. Therefore, the
corresponding space is the 2D space R2.
The graph of this equation is the circle centered at the origin with radius 2.
In 2D space, the graph of a circle is a circle.
3.2. Graph of a cercle in 3D space
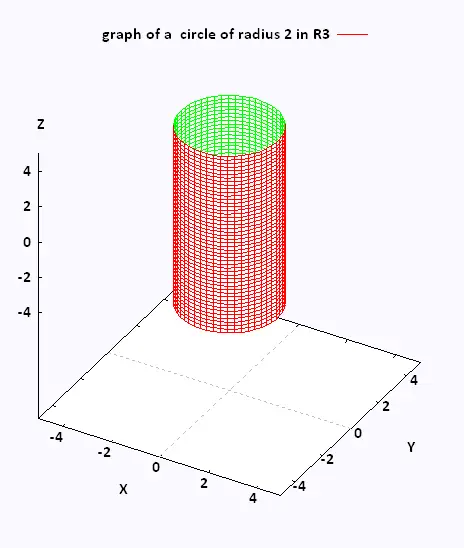
We consider the exemple of the circle of radius r = 2, and of equation
x2 + y2 = 4
In R3 space, the graph of this equation is not a circle.
Since we do not have specified a value of z, this means
that z will take any value.
So at any value z we have a circle of radius 2 centered on the z-axis.
So, in R3, the graph of the circle's equation is then a
vertical cylinder, of radius 2, centered on the z-axis, that passes through the cercle given
by
x2 + y2 = 4 in the xy-plane.
This vertical cylinder, parallel to the z-axis, intersects the
xy-plane with its 2D graph.
In 3D space, the graph of a circle is a cylinder.
|
|